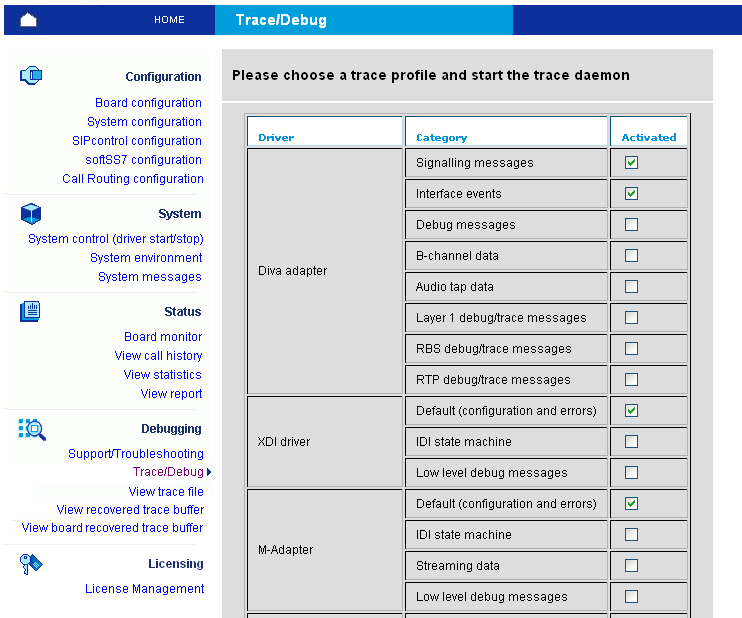
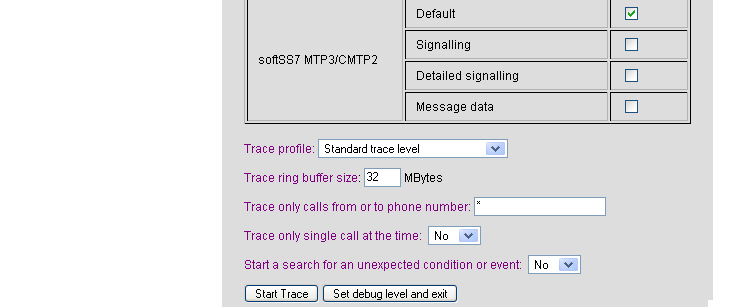
This page allows you to select the trace profile and level, to set trace ring buffer size and to activate the background trace process:
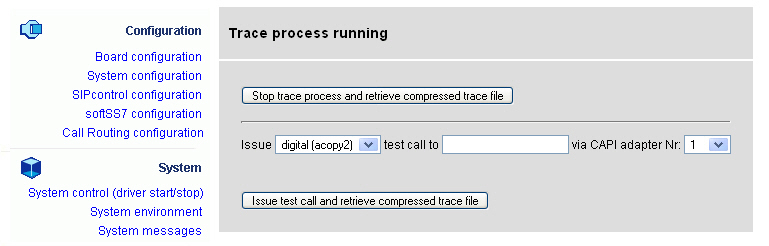
Once the trace process (ditrace) is running you can issue one test call or stop the trace process and retrieve compressed trace file.
At any time you can view the context of the trace ring buffer file (even if the trace process is still running) using the trace file viewer. See View trace file for more information.