In the Status section, you can configure the following types of parameters:
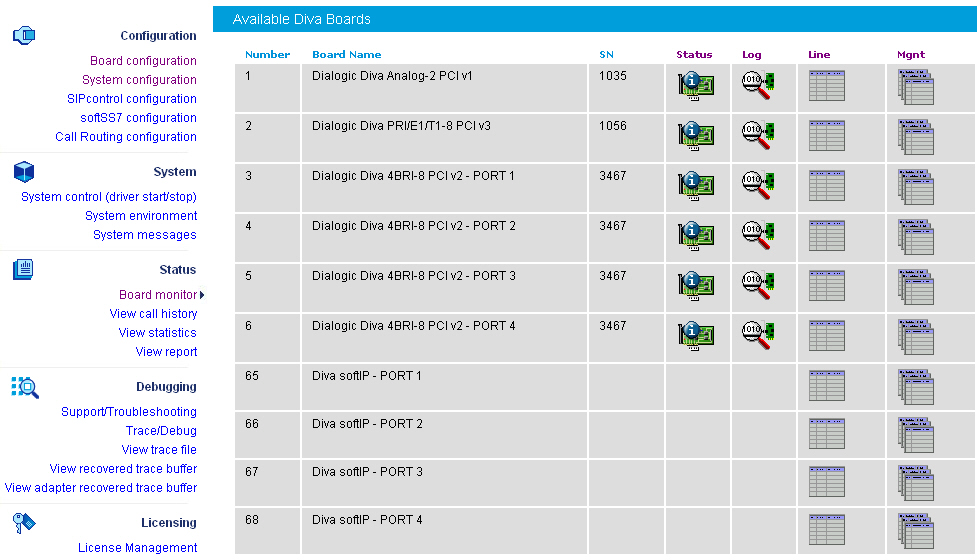
If you click Board monitor on the left hand side, the following page opens, which allows you to check the current status and the configuration of the installed Diva Media Boards, to read internal board trace buffers (XLOG) and to gain access to the Management Interface of Diva Media Boards and drivers:
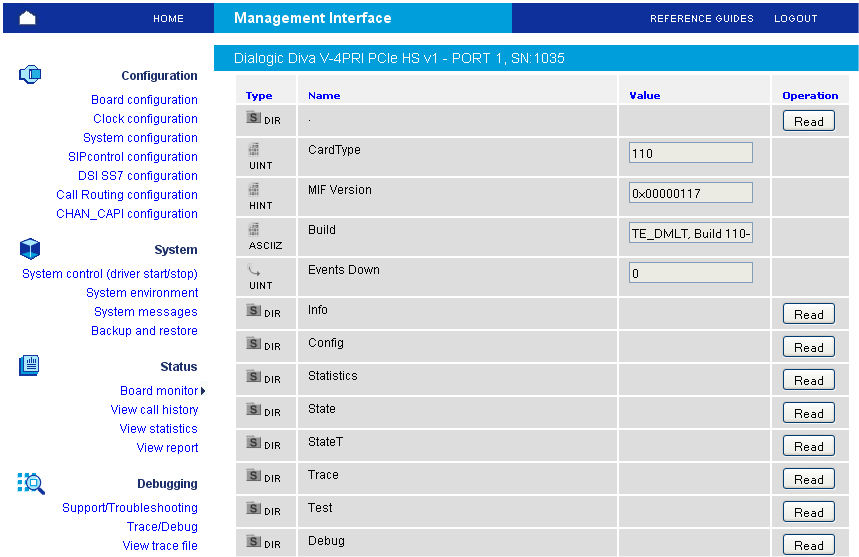
You can navigate through the Management interface of the selected Diva Media Board or driver using the management interface browser:

The management interface is available for:
Diva Media Boards, as described in Dialogic® Diva® Media Board management interface.
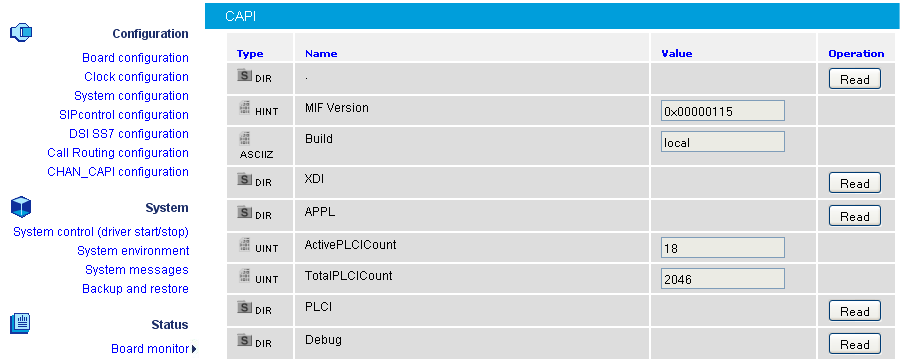
The CAPI driver, as described in CAPI driver management interface.
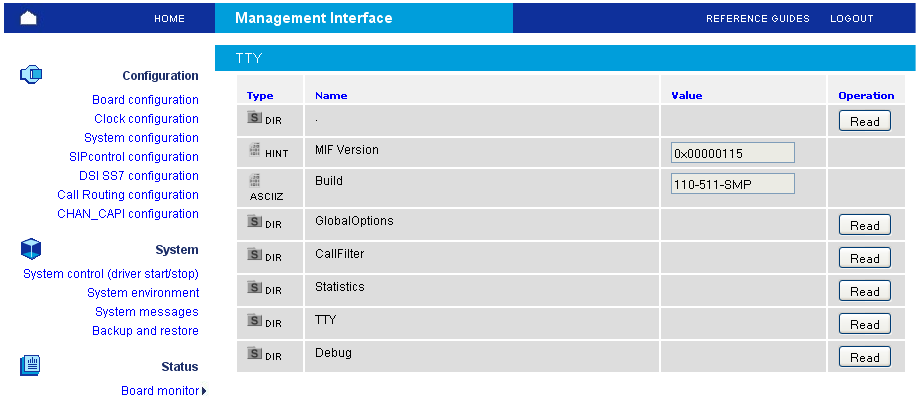
The Diva TTY driver, as described in Dialogic® Diva® TTY driver management interface.
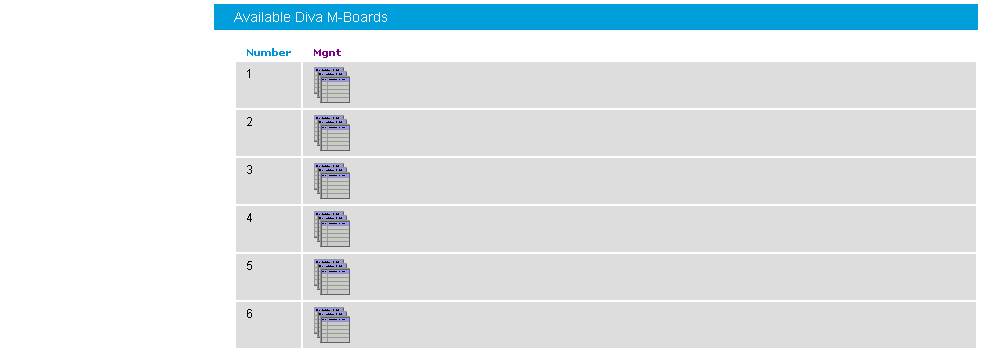
If you click the icon below Mgnt in the Available Diva Board section, the management interface browser opens. The management interface browser allows you to navigate through the management interface directories, read, write, and execute management interface variables using the buttons under Operation.
If you click the icon below Mgnt for the CAPI driver in the Available System Release driver section, the management interface browser opens. The management interface browser allows you to navigate through the management interface directories, read, write, and execute management interface variables using the buttons under Operation.
If you click the icon below Mgnt for the TTY driver in the Available System Release driver section, the management interface browser opens. The management interface browser allows you to navigate through the management interface directories, read, write, and execute management interface variables using the buttons under Operation.
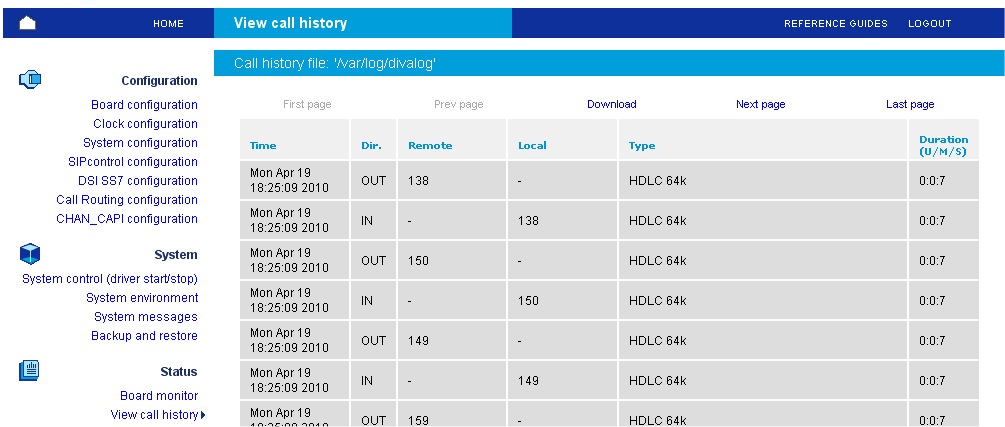
This page allows you to view the last segment (up to 10000 calls) of the call record that is stored in the /var/log/divalog file. This file contains the information about call time, duration, call parameters, e.g., calling/called party numbers, used protocol, transmission speed, remote fax station id, or fax features.
The record file of the call is stored in ASCII format and can be downloaded to a local machine. To receive more details on the format of the call record file, read about the divalogd accounting utility see divalogd Accounting Utility.
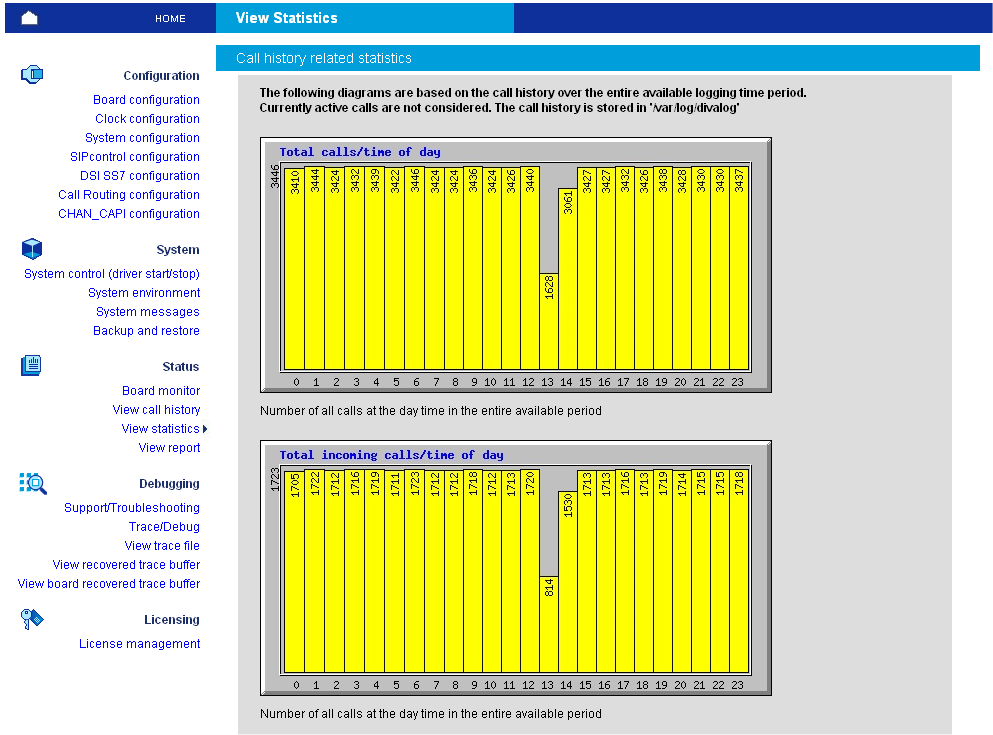
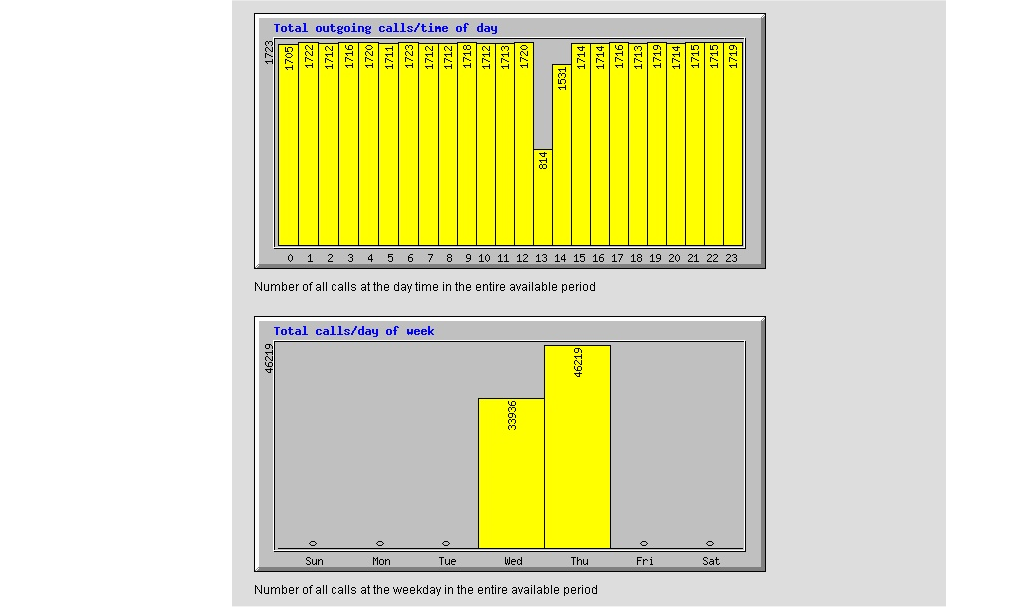
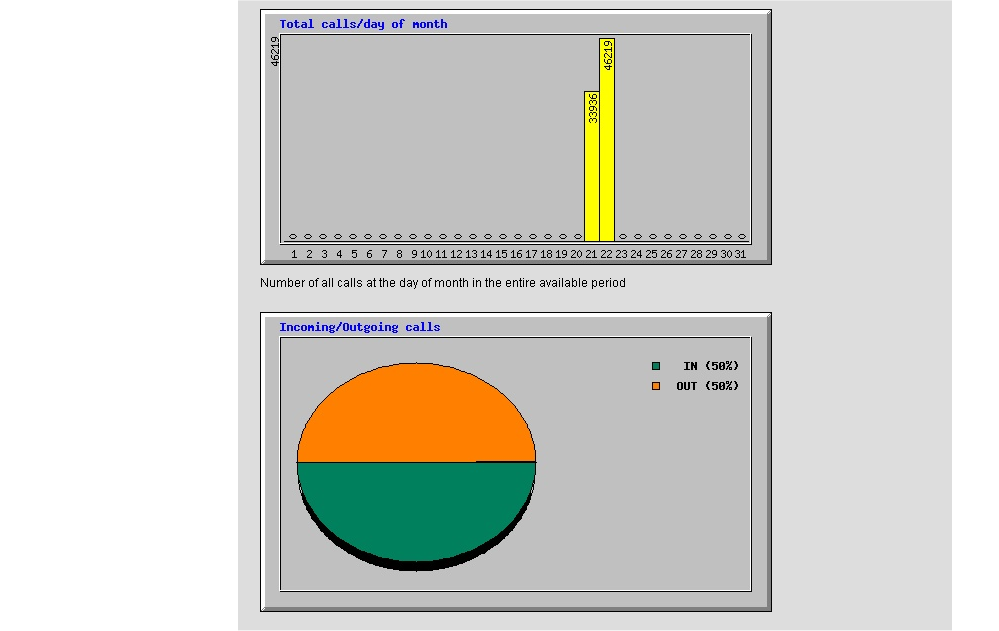
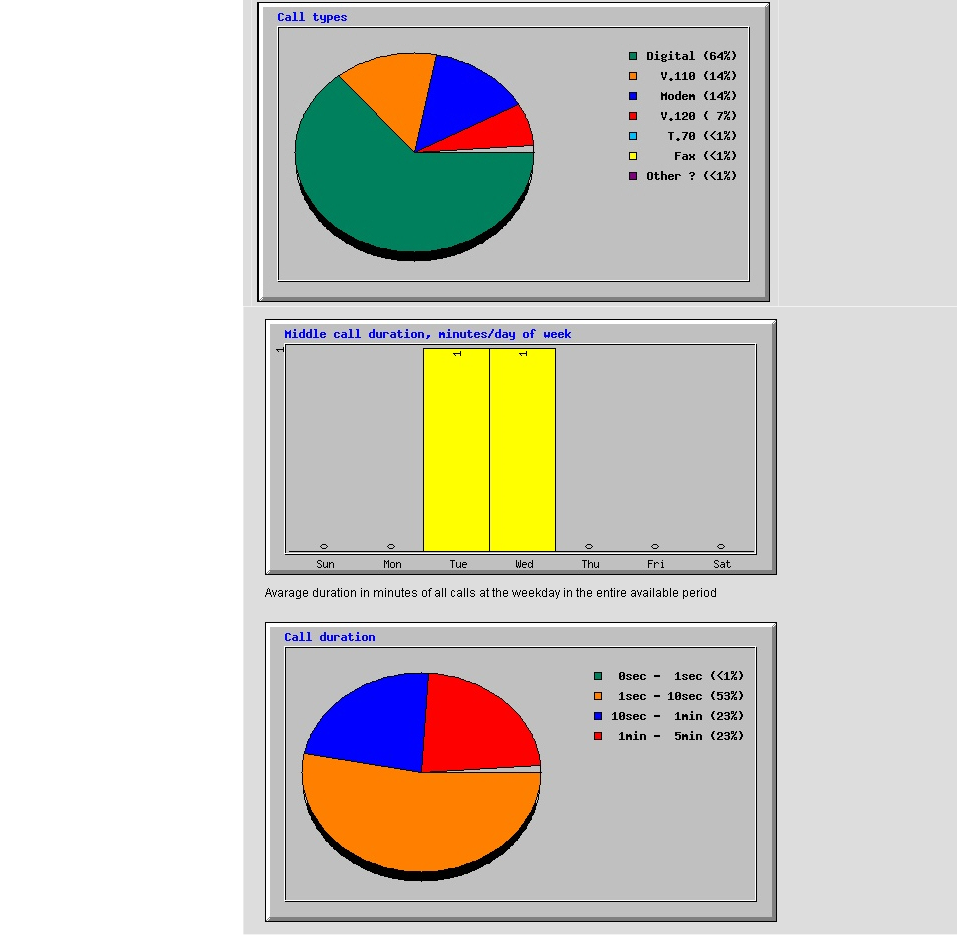
This page allows you to perform statistical analysis of the call record (call journal) files. The result of the analysis is presented as sequence of pie- and chart- diagrams (stored as JPEG files).
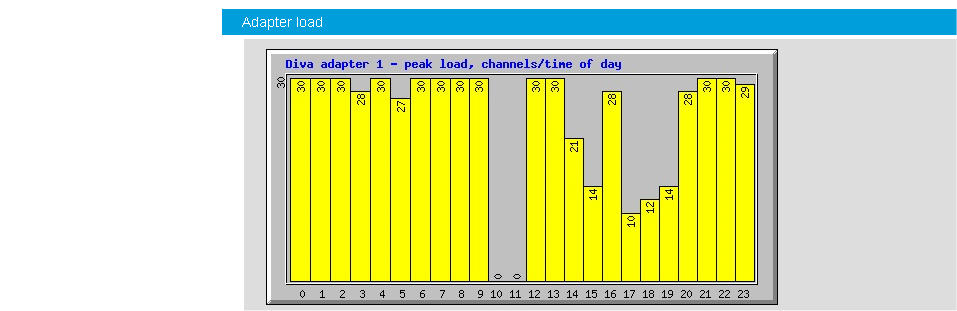
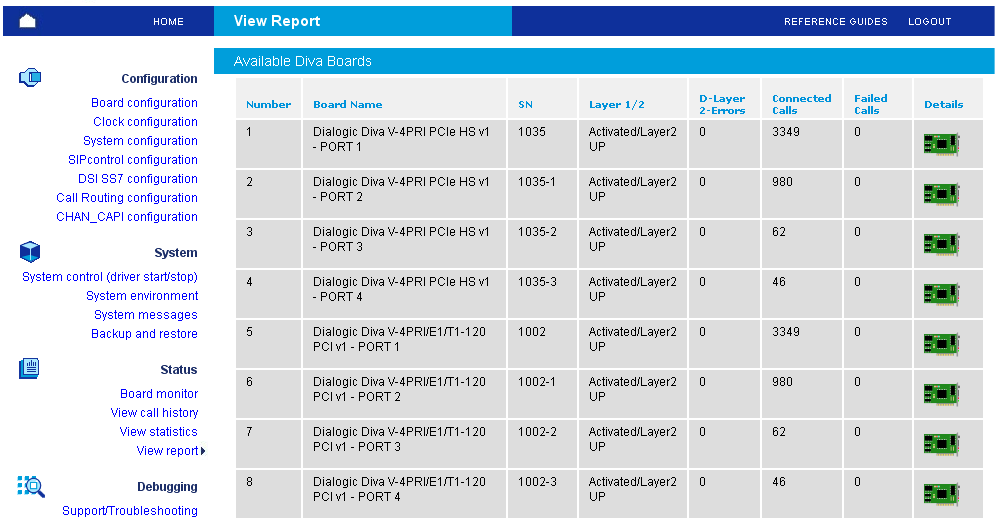
This page allows you to view the state and the cumulative statistics for the active Diva Media Boards. If you click the board icon below Details, the information listed here is displayed. The information contained in the report originates from the management interface of the Diva Media Boards.
Link status (Layer 1 state, Layer 1 alarms, Layer 2 state).
Total amount of Layer1/Layer2 frames/bytes transferred over the D-channel.
Total amount of Layer1/Layer2 errors detected in the D-channel frames.
Total amount of Layer1/Layer2 frames/bytes transferred over the B-channels.
Total amount of Layer1/Layer2 errors detected in the B-channel frames.
Total amount of calls.
Total amount of successful calls.
Total amount of failed calls, sorted by cause (User Busy, Incompatible destination, etc.).
Total amount of successful modem calls.
Total amount of failed modem calls, sorted by cause (Not a modem device, etc.).
Total amount of successful fax calls.
Total amount of failed fax calls, sorted by cause (Not a fax device, Forced by application, etc.).