In the Debugging section, you can configure the following types of parameters:
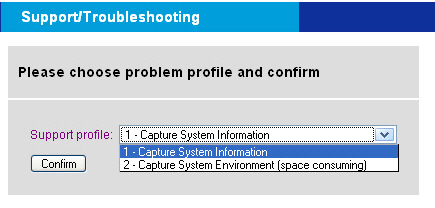
In case of a problem, you can use this page to capture relevant information for your support request:
You can invoke the support procedure in two modes: The first mode captures the most important information about your system in one text file, whereas the second mode captures system environment information (kernel image, modules, configuration files) that allows the Dialogic Customer Support personnel to reproduce your environment locally. Finally, you can download the report file as compressed archive.
This page allows you to select the trace profile and level, to set trace ring buffer size and to activate the background trace process:
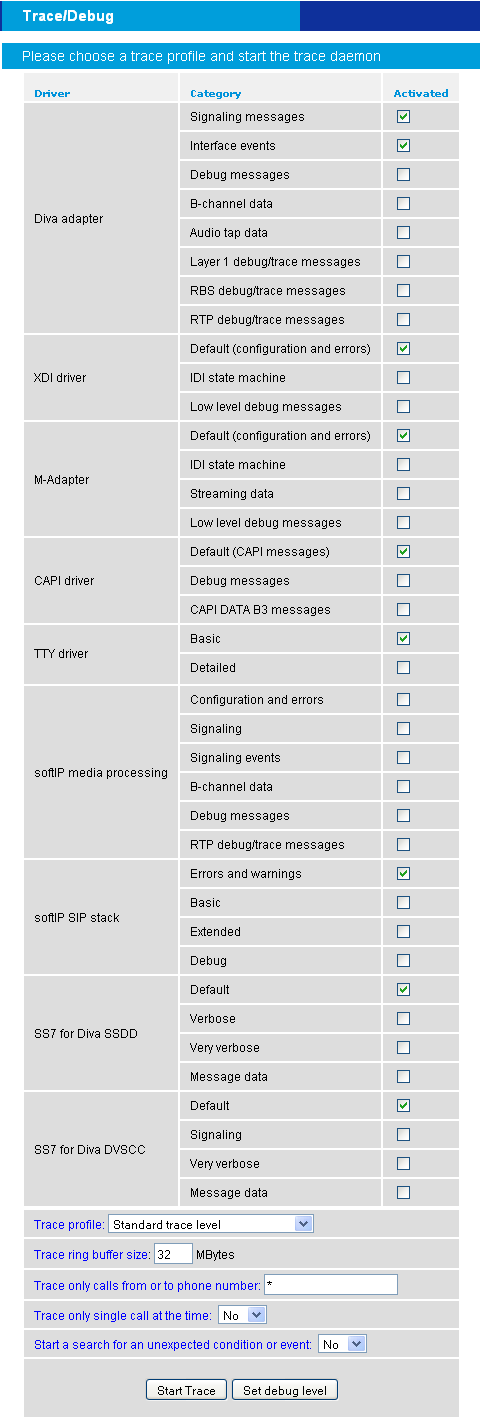
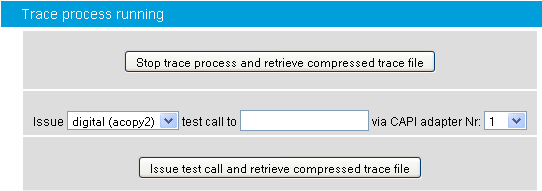
Once the trace process (ditrace) is running, you can issue one test call or stop the trace process and retrieve compressed trace file.
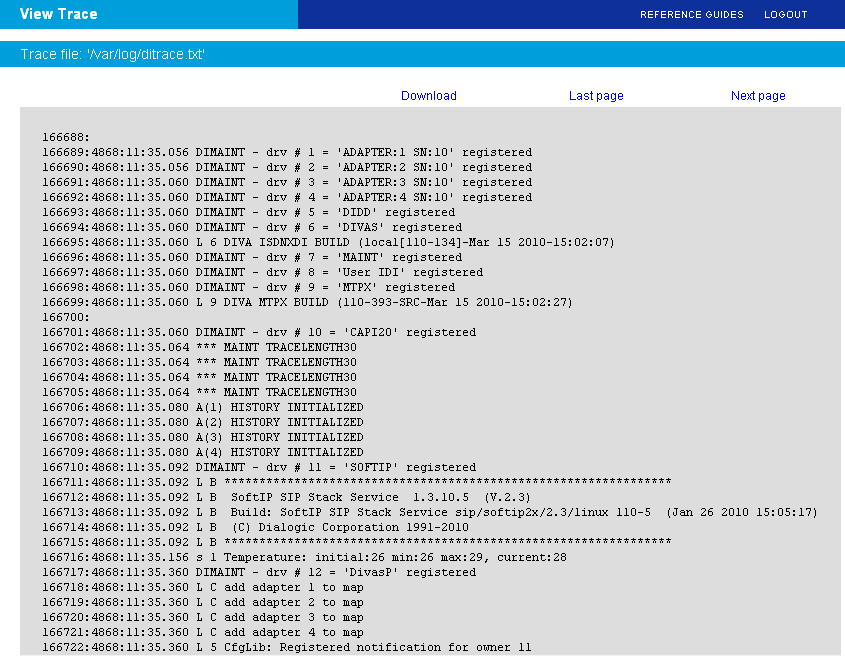
At any time, you can view the context of the trace ring buffer file (even if the trace process is still running) using the trace file viewer. See View trace file for more information.
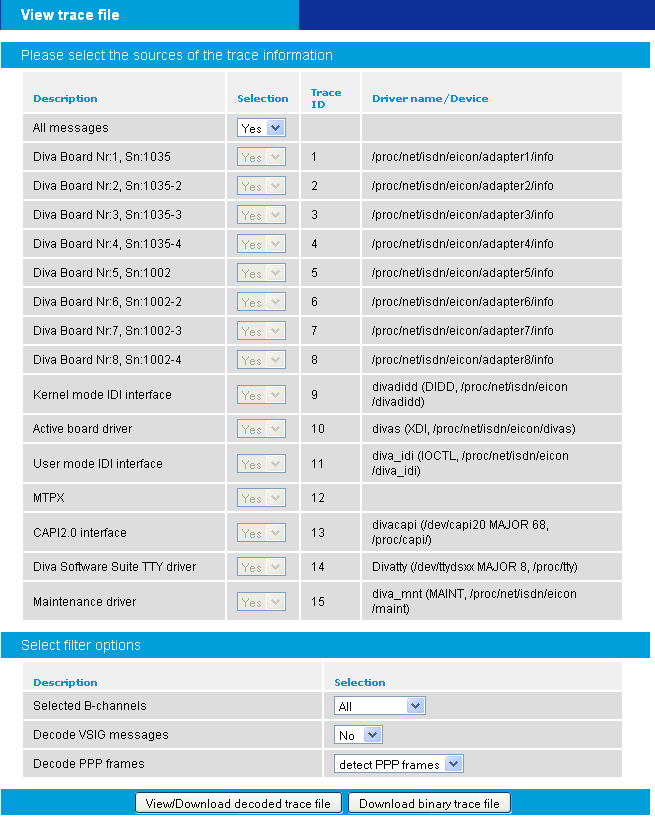
This page allows you to decode and to view a trace file. You can filter the trace file to view only specific sources of information:
Finally, you can view or download the decoded trace file:
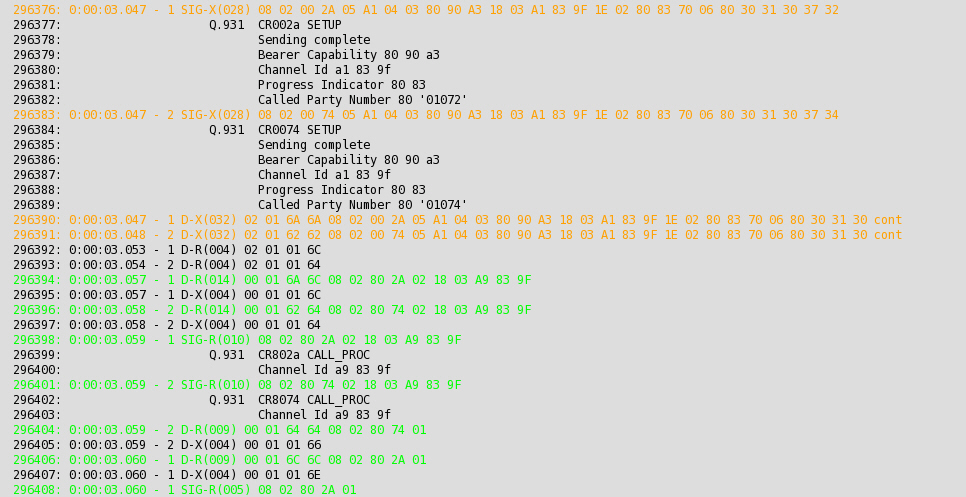
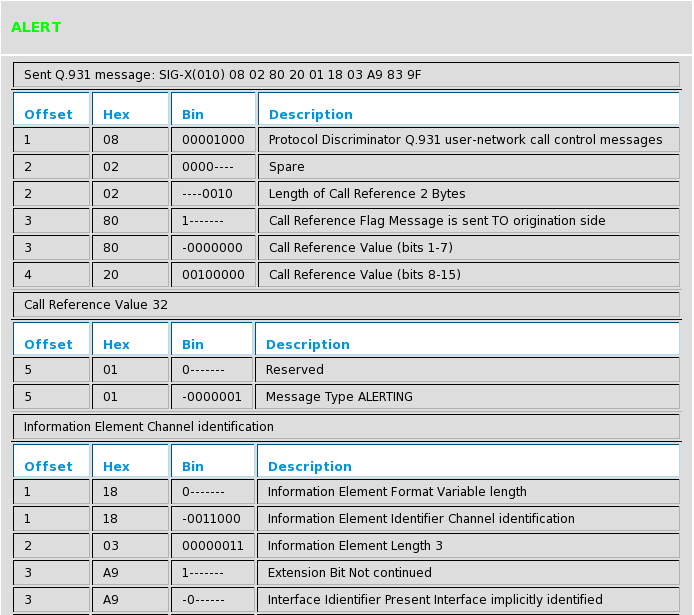
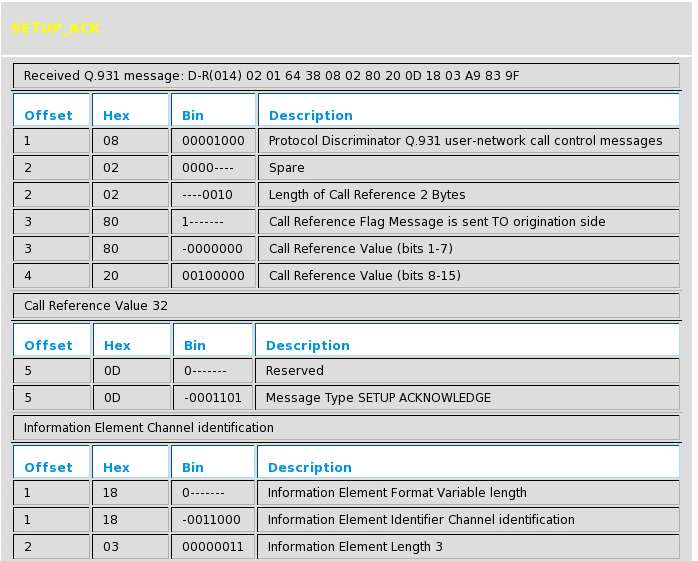
Orange and green trace messages deal with the call establishment:
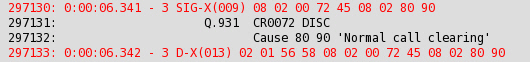
Red trace messages deal with the call release:
Some of the messages are displayed as HTML links (underlined). You can receive more information about messages if you activate the link:
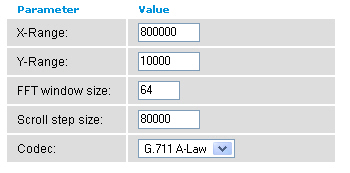
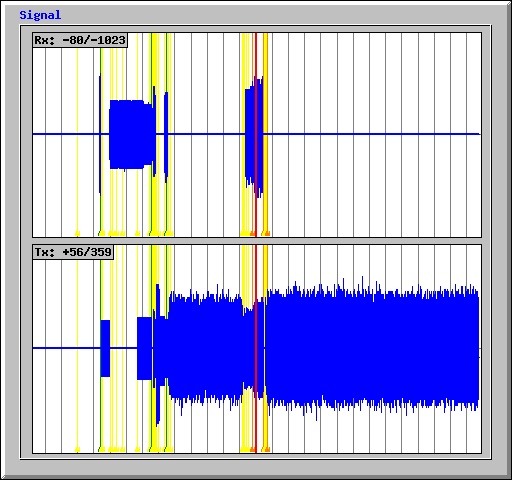
The blue trace messages (and HTML links) deal with AudioTap data. Audio taps are the audio data samples on the input (output) of the analog modem and fax DSP code combined with control information from the DSP code (events, EYE patterns). You can click the silver HTML link to start the Audio Tap Analyser that includes numerous tools.

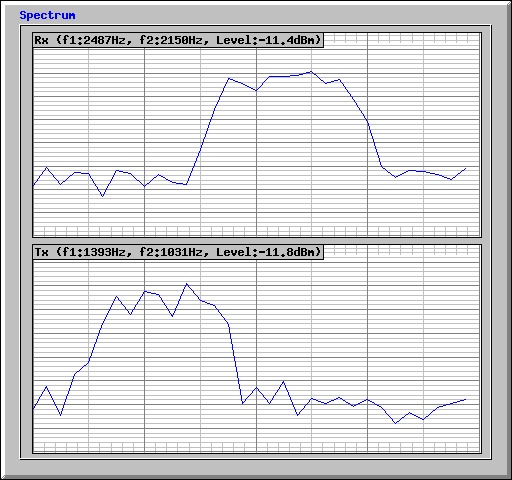
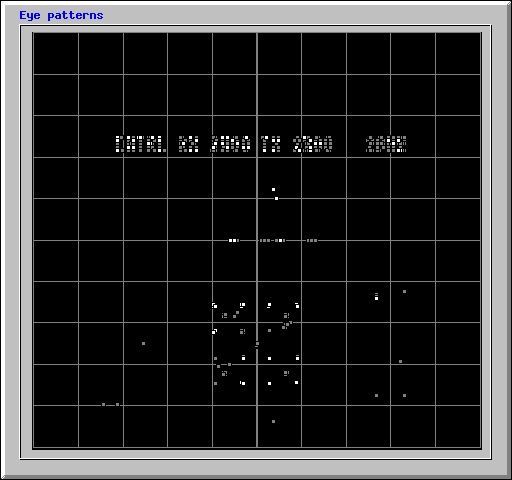
Moreover, it is possible to download an Audio Tap file in "WAV" file format.

This page allows you to view or download the decoded trace file.
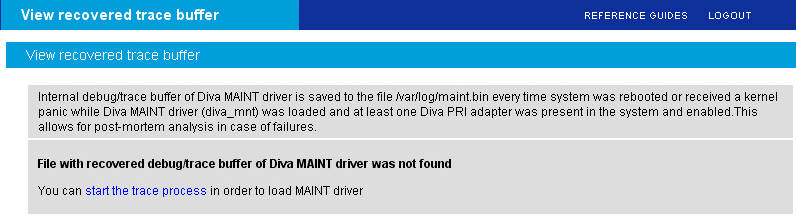
The internal debug/trace buffer of Dialogic® Diva® MAINT driver is saved to /var/log/maint.bin file every time system was rebooted or received kernel panic at time Diva MAINT driver (diva_mnt) was loaded and at least one Diva PRI Media Board was present in the system and was in the active state.
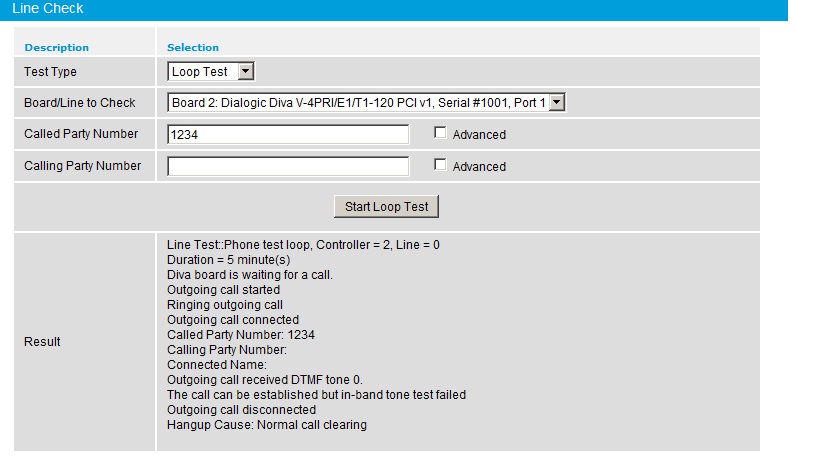
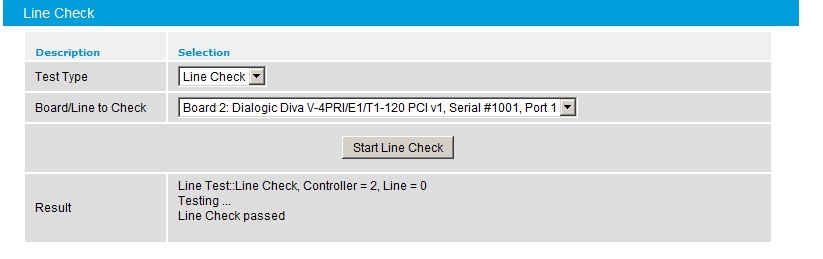
This page offers the following test types:
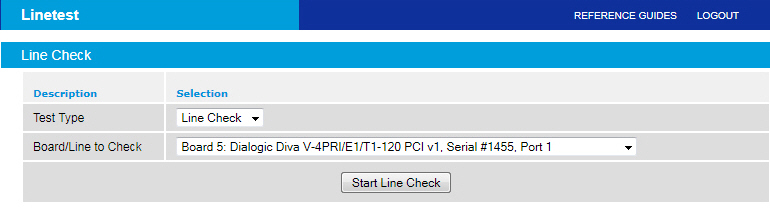
Performs a quick check of your software installation and the physical connection.
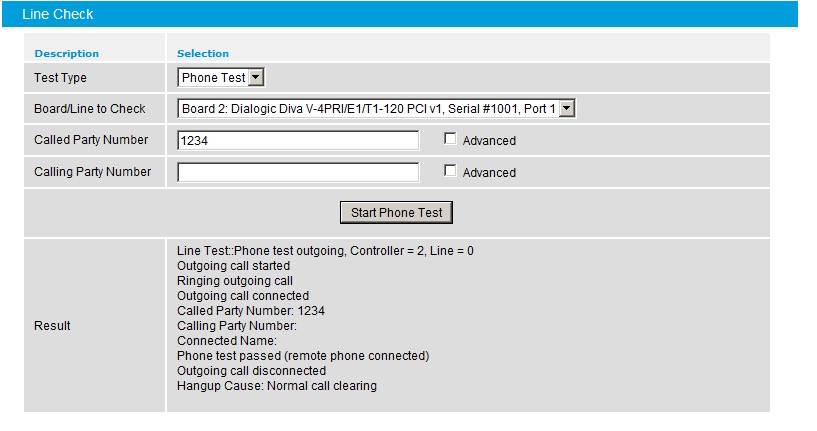
Performs a simple test call to another phone to test the connection.
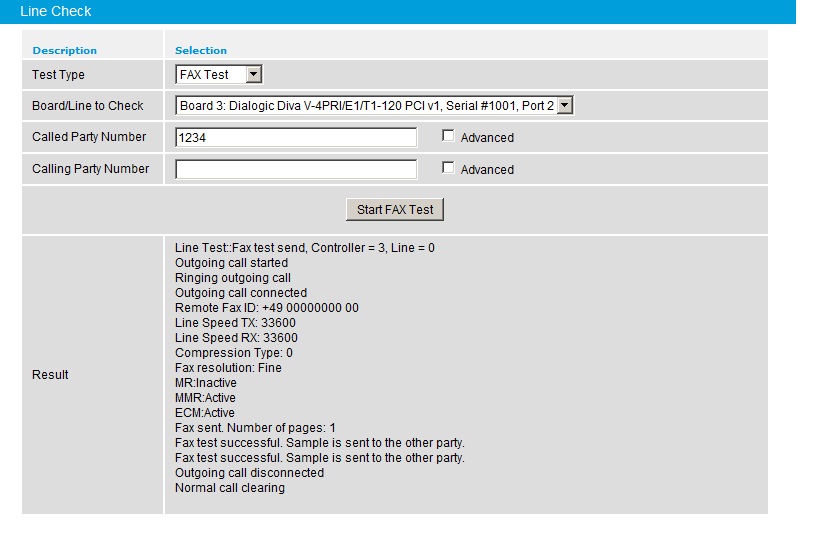
Performs a basic bidirectional fax test.
Performs an in-band tone test verifying the end-to-end connectivity.