In the Status section, you can configure the following types of parameters:
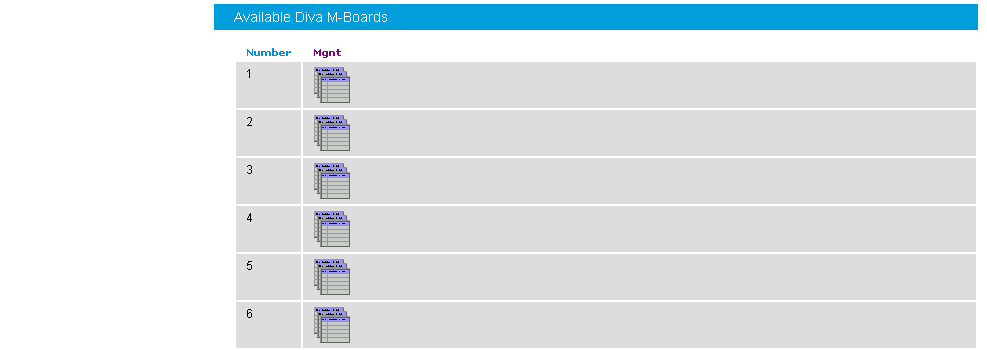
If you click Board monitor on the left hand side, the following page opens, which allows you to check the current status and the configuration of the installed Diva Media Boards, to read internal board trace buffers (XLOG) and to gain access to the Management Interface of Diva Media Boards and drivers:
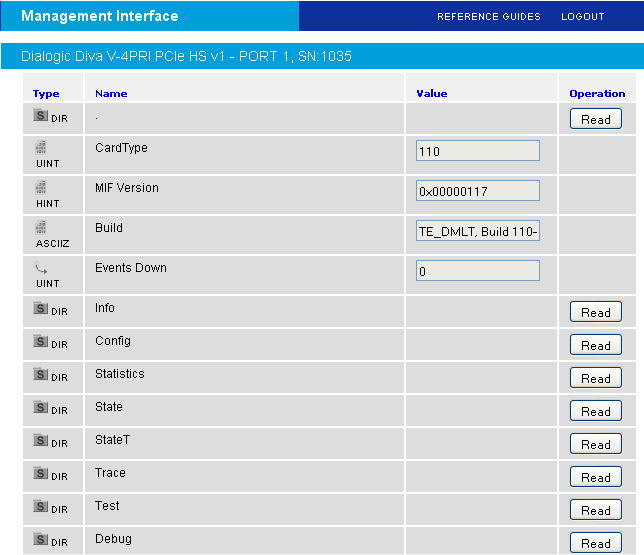
You can navigate through the Management interface of the selected Diva Media Board or driver using the management interface browser:

The management interface is available for:
Diva Media Boards, as described in Dialogic® Diva® Media Board management interface.
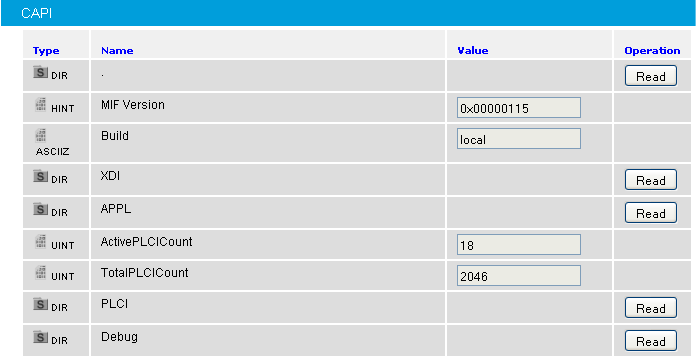
The CAPI driver, as described in CAPI driver management interface.
The Diva TTY driver, as described in Dialogic® Diva® TTY driver management interface.
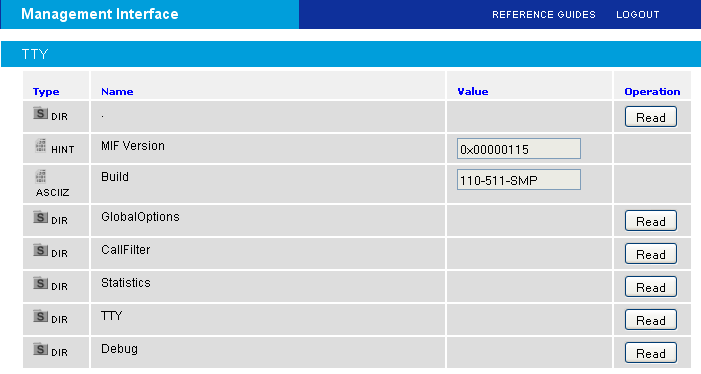
If you click the icon below Mgnt in the Available Diva Board section, the management interface browser opens. The management interface browser allows you to navigate through the management interface directories, read, write, and execute management interface variables using the buttons under Operation.
If you click the icon below Mgnt for the CAPI driver in the Available System Release driver section, the management interface browser opens. The management interface browser allows you to navigate through the management interface directories, read, write, and execute management interface variables using the buttons under Operation.
If you click the icon below Mgnt for the TTY driver in the Available System Release driver section, the management interface browser opens. The management interface browser allows you to navigate through the management interface directories, read, write, and execute management interface variables using the buttons under Operation.
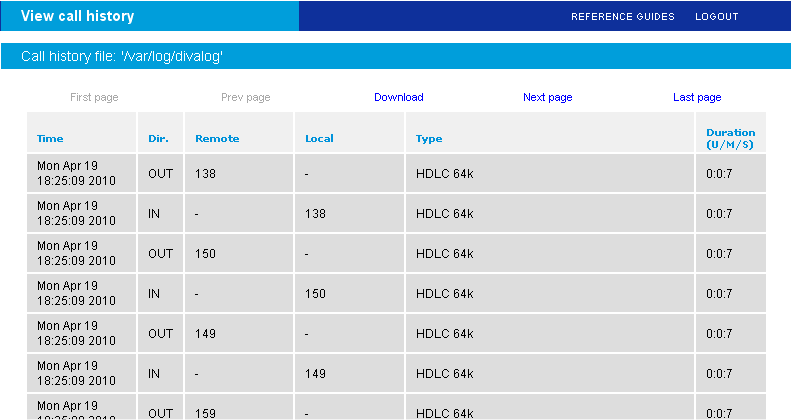
This page allows you to view the last segment (up to 10000 calls) of the call record that is stored in the /var/log/divalog file. This file contains the information about call time, duration, call parameters, e.g., calling/called party numbers, used protocol, transmission speed, remote fax station id, or fax features.
The record file of the call is stored in ASCII format and can be downloaded to a local machine. To receive more details on the format of the call record file, read about the divalogd accounting utility see divalogd Accounting Utility.
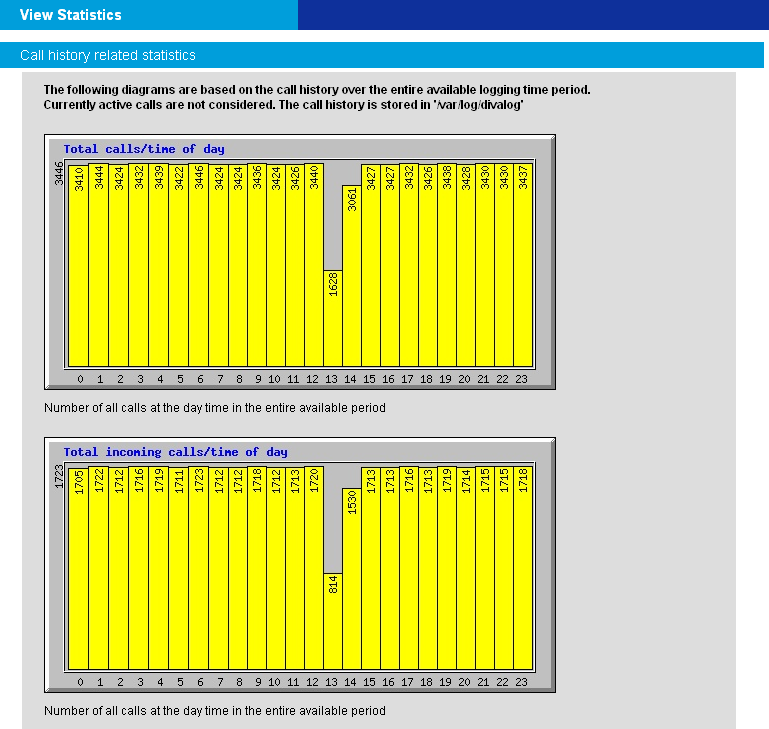
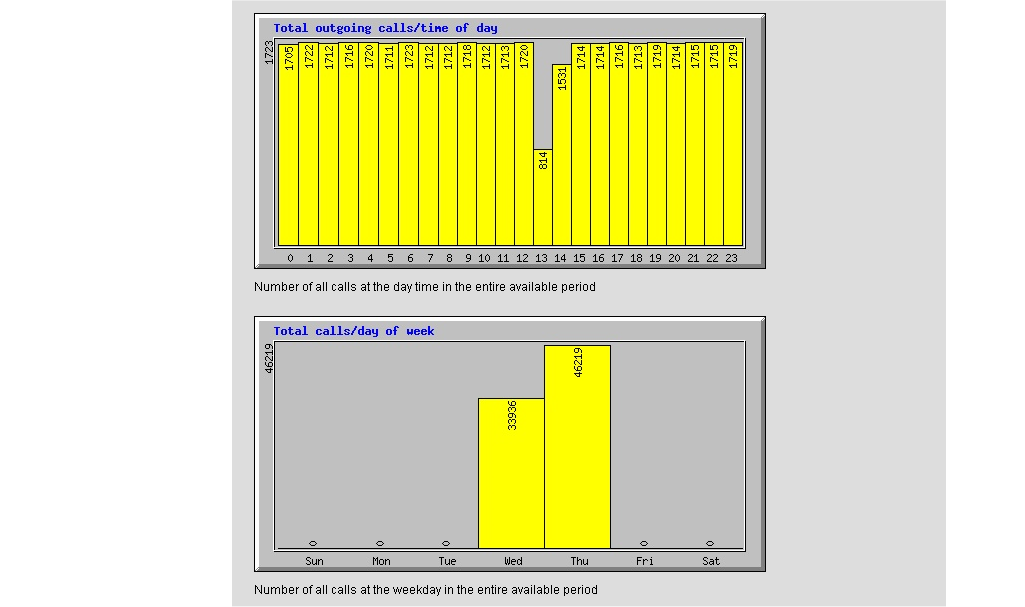
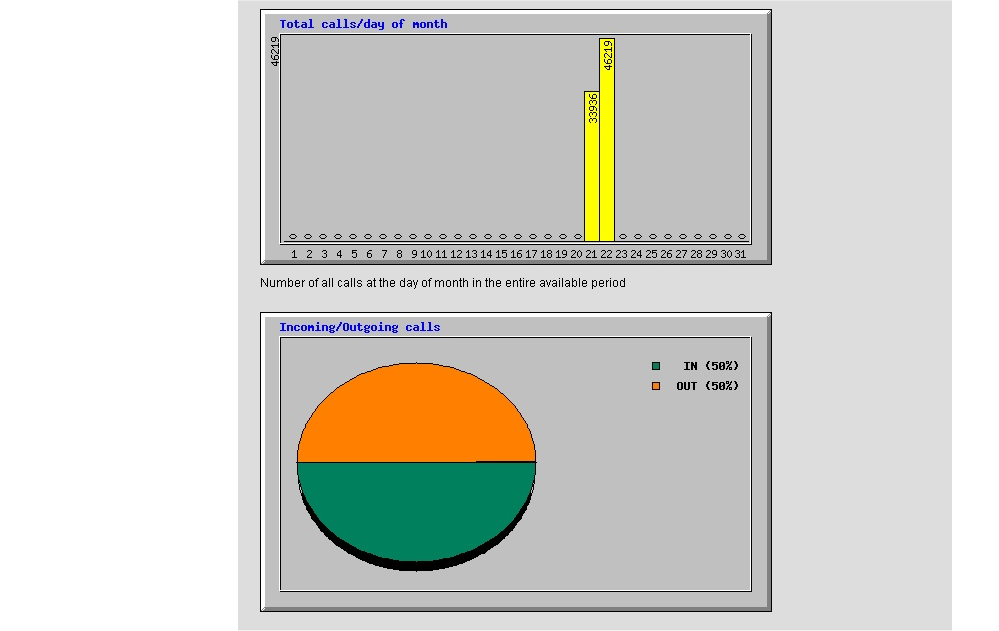
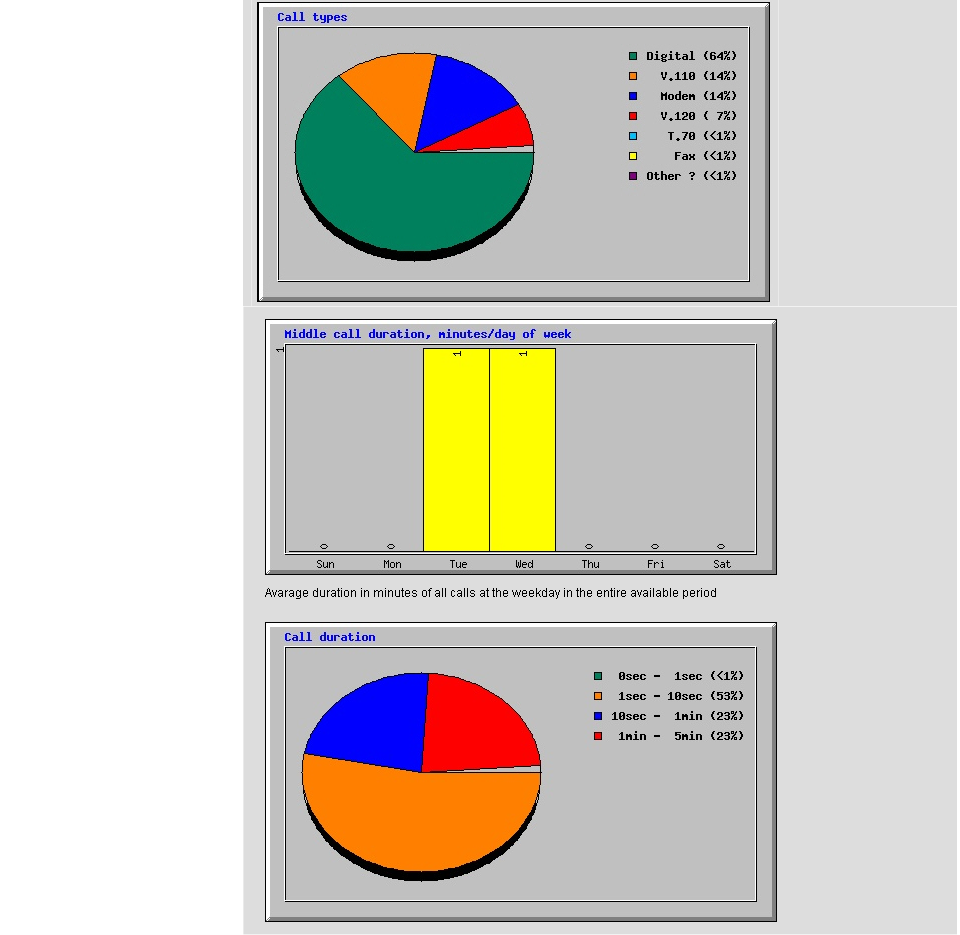
This page allows you to perform statistical analysis of the call record (call journal) files. The result of the analysis is presented as sequence of pie- and chart- diagrams (stored as JPEG files).
If you click View report, the Actual Board Statistics page opens:
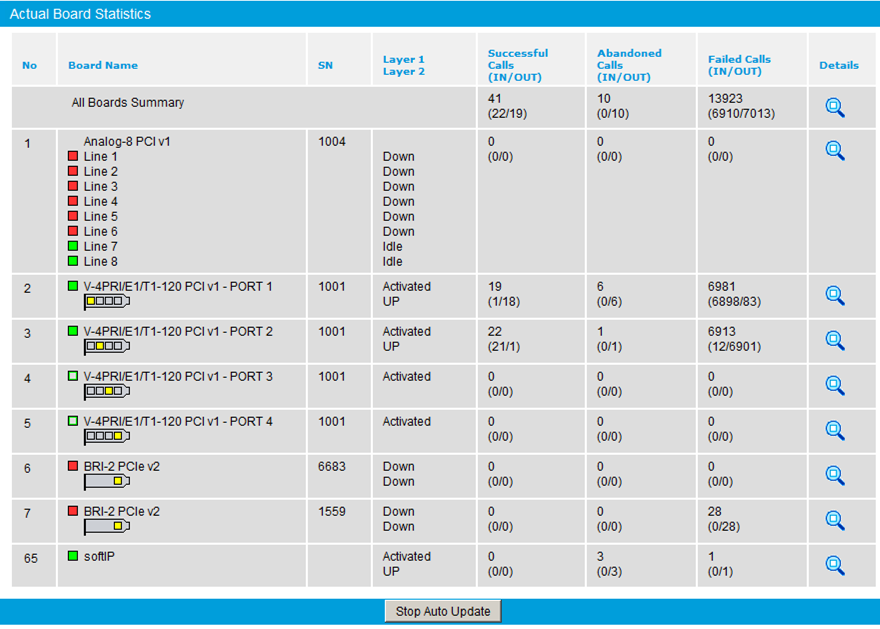
The Actual Board Statistics page displays the status of all Diva Media Boards and the cumulative statistics for the active Diva Media Boards, including the number of failed, successful, and abandoned calls. An abandoned call is a call that the caller ends before the call was connected. For example, an abandoned call occurs when a call goes into the ringing state, and the caller hangs up the phone before the called party replies with a "busy," "rejected," or "connected" signal.
A colored symbol in the Board Name column illustrates the line plug status:
Red: No signal; system is inactive.
Yellow: Remote synchronization error.
Green: System is active and functioning normally.
Click the plug status symbol to see additional information about the Layer 1 alarm state. For example:
Green symbol on Analog board: "Cable detected"
Green symbol on ISDN board: "Layer 2 connected"
Red symbol on Analog board: "No cable detected”
Red symbol on ISDN board: "Layer 1 error"
If there is a Remote Yellow, Blue, or Red alarm condition, clicking the plug status symbol shows a typical E1/T1 alarm message for the alarm. If two alarm conditions occur at the same time, only the most critical alarm is displayed. For example, if a Red alarm condition occurs at the same time as a Yellow alarm condition, only the Red alarm is displayed. If Layer 2 is up, then Layer 1 is also up.
To display cumulative call and fax statistics for all Diva Media Boards, click the magnifying glass at the end of the All Boards Summary row on the Actual Accumulated Board Statistics page. The Actual Accumulated Board Statistics page opens.
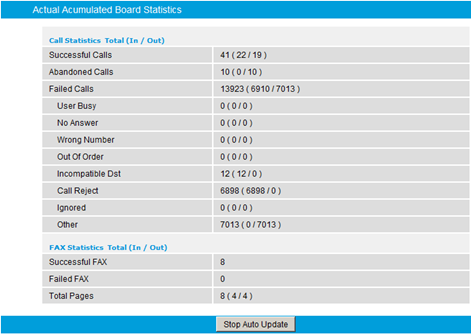
The displayed information includes the total number of successful, abandoned, and failed calls, a summary of the most frequent call disconnect causes, the total number of successful and failed fax calls, and the total number of fax pages received and sent. (In the parentheses of the Total Pages field, the number of received faxes is on the left and the number of sent faxes is on the right.) The information contained in the report originates from the management interface of the Diva Media Boards
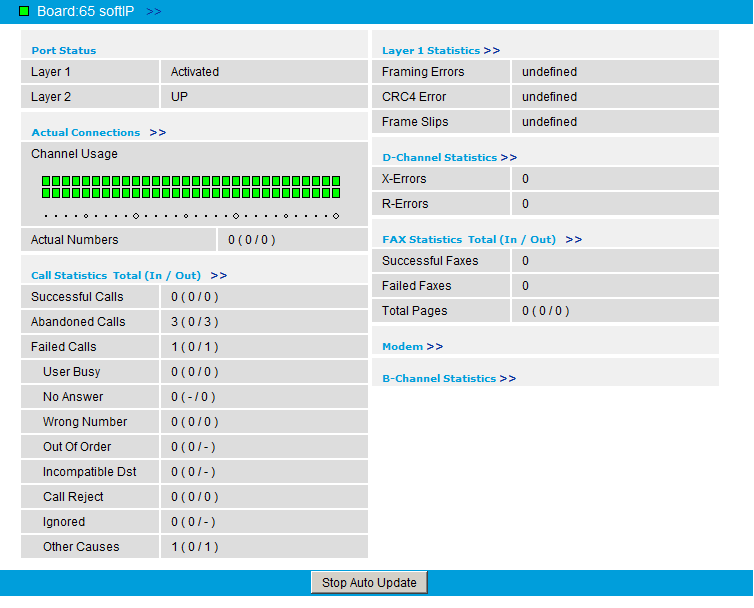
To display details for a specific board, click the magnifying glass at the end of the associated row on the Actual Accumulated Board Statistics page. The displayed information includes the port status, channel usage, board temperature, and call and fax statistics. The information contained in the report originates from the management interface of the Diva Media Boards.
The following screenshot shows the details view for a PRI board:
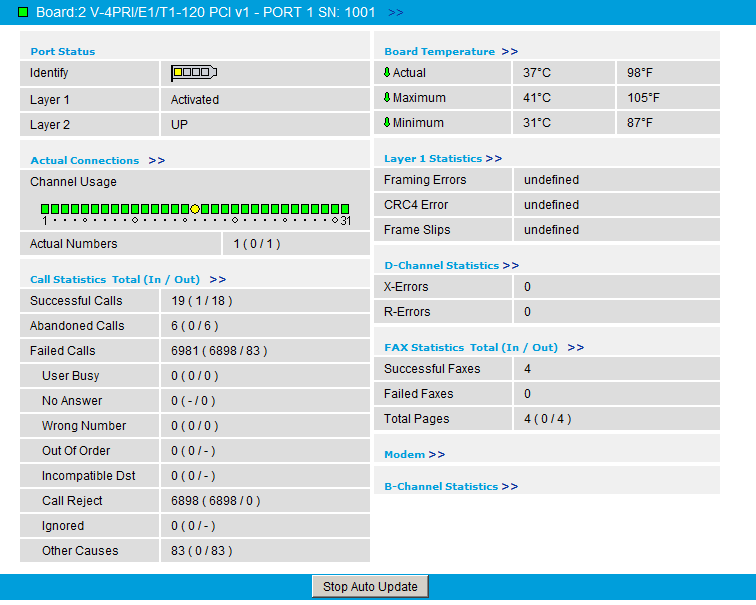
In the details view for PRI or BRI boards:
The Channel Usage display is correlated to the number of available channels. In this example, because the PRI Board has 31 channels, the Channel Usage field shows 31 lamps — one for each channel.
The bracket symbol in the Port Status area shows the number of ports for the BRI or PRI board. The highlighted port is associated with the Layer 1 and Layer 2 statistics displayed below the bracket symbol.
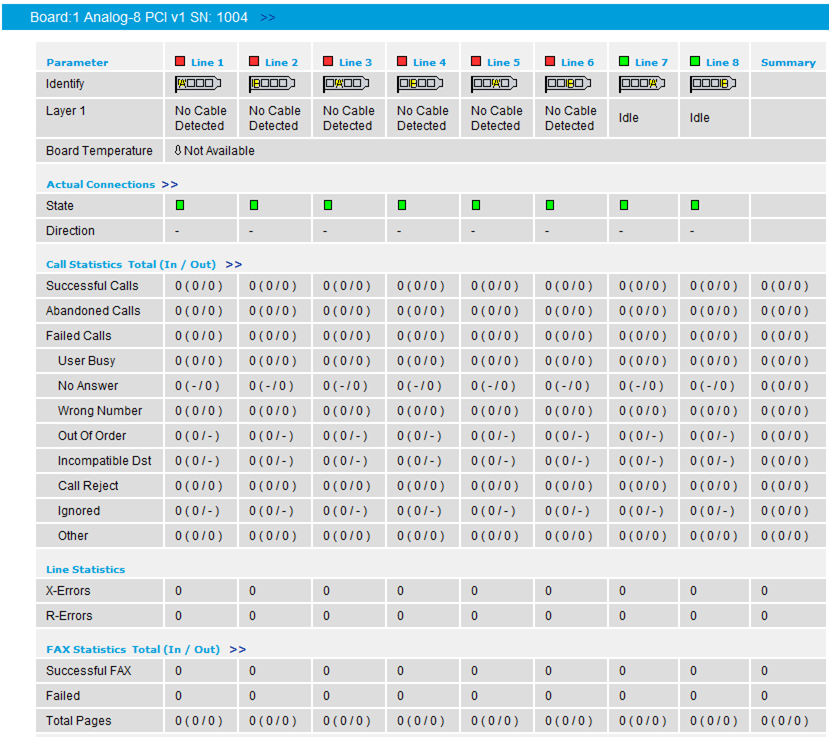
The following screenshot shows the details view for an analog board:
The following screenshot shows the details view for an softIP board: