Dialogic® PowerMedia™ Extended Media Server (PowerMedia XMS) - more articles
How to enable and collect logs for troubleshooting purposes
Introduction:
This article describes how to enable and collect logs for troubleshooting purposes from a Dialogic® PowerMedia™ XMS installation.
Procedure:
Step I: Enabling Logs
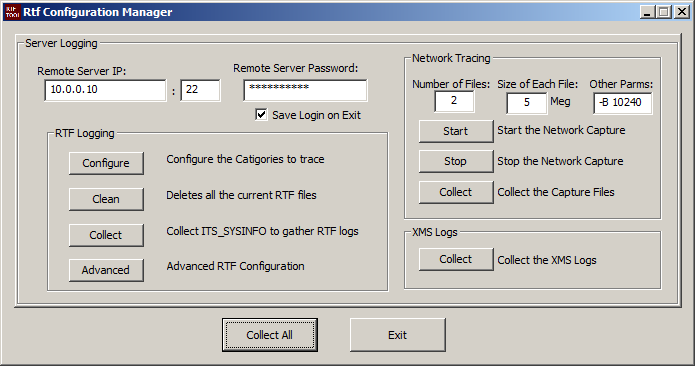
PowerMedia XMS ships with a graphical tool called Window Logger Manager Tool, also known as "RtfToolGui". It is a tool that can be started from a Windows PC to enable or disable RTF tracing, start or stop network capture, and collect RTF, network capture and XMS Services logs remotely.
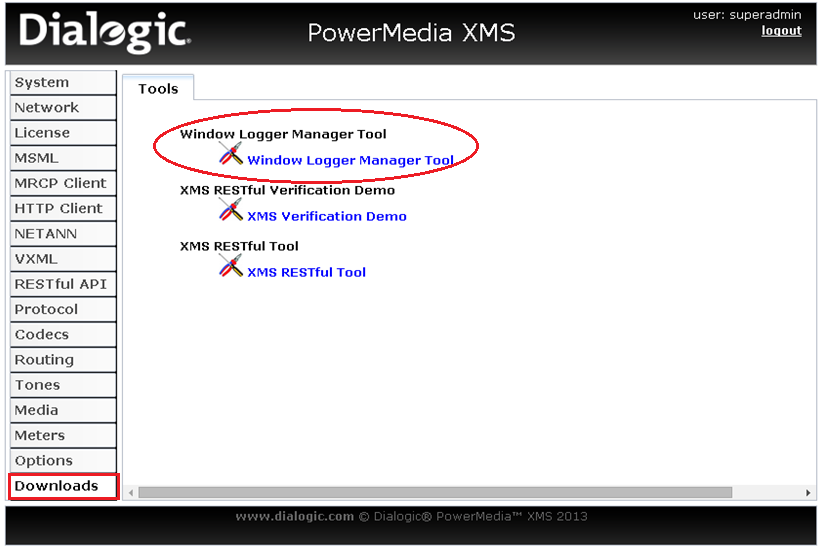
This tool is downloadable from the Download page of the Web User Interface (WebUI) as shown below. Download and install this tool on a Windows PC.
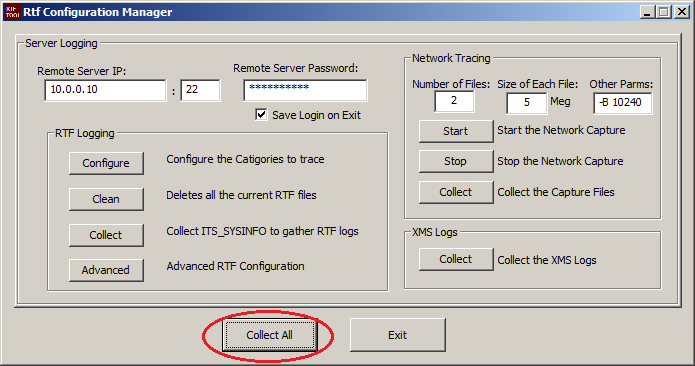
Run RtfToolGui on a Windows PC from which the PowerMedia XMS server is accessible. This will bring up the main screen below:
Enable or disable RTF traces
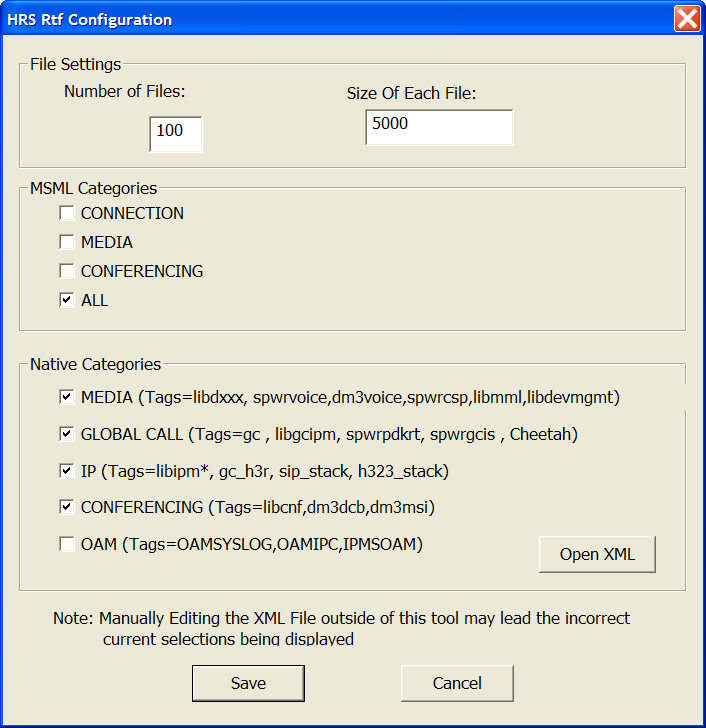
Click on the Configure button to enable or disable RTF tracing modules. In the example below, tracing is enabled for Media, Global Call, IP, Conferencing and MSML categories. The number of files to preserve is set at 100, each of which will be 5MB, thus a total of 500MB of disk space will be required for logs in this example. You can define your own values depending on your requirements. The Open XML option is for expert users and is rarely required.
Once changes are completed, click on the Save button to save and apply changes.
The Advanced button on the main screen allows you to download the RTF tracing configuration file, RtfConfigLinux.xml, to your local system, which can then be modified, uploaded and reloaded manually. This option should be used if Dialogic Support has provided a customized RTF configuration file that is to be applied to your system.
Start or stop network capture (tcpdump)
RtfToolGui uses the operating system "tcpdump" command to capture a network trace. Click on the Start button from main screen of the tool to start capturing network packets on the PowerMedia XMS server. Click on the Stop button stop the active tracing.
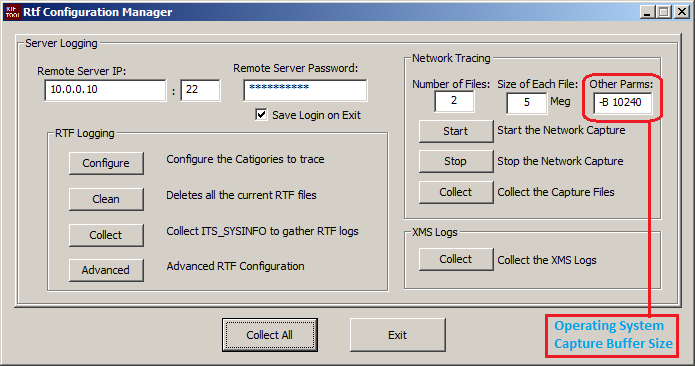
There are options available to set the number of files to keep and the maximum size of each capture file. It is also possible to pass tcpdump specific command line arguments using the Other Parms text box. In the example below, the operating system capture buffer size parameter is set in the command line.
Enabling PowerMedia XMS services tracing
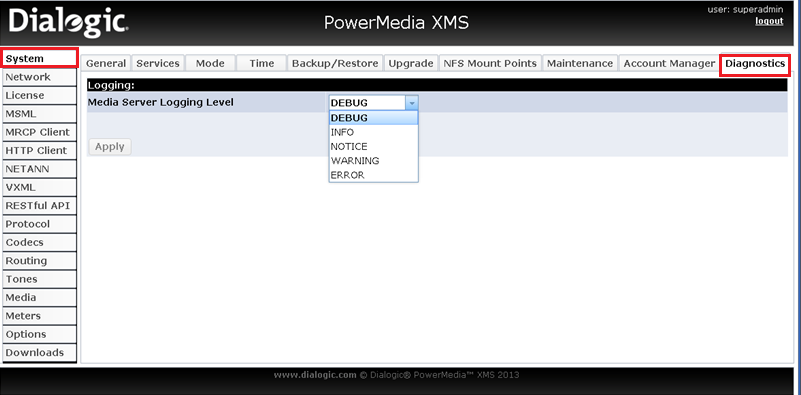
Log on to the WebUI, and click on the Diagnostics tab on the System page. Select the logging level from the drop-down list and click on Apply button.
Step II: Collecting captured logs
To gather ALL the captured logs (RTF logs, Network Capture and PowerMedia XMS services) click on the Collect All button. This will pull down all the logs from the server. Individual Collect buttons are also available for each group. Please note that the name of the path to the file must not have any spaces in it, or download of the logs will fail.
Product List:
Dialogic® PowerMedia™ XMS 2.0 and later
First published: 03-Oct-2014
Open access: Product rule: open; Page rule: Auto